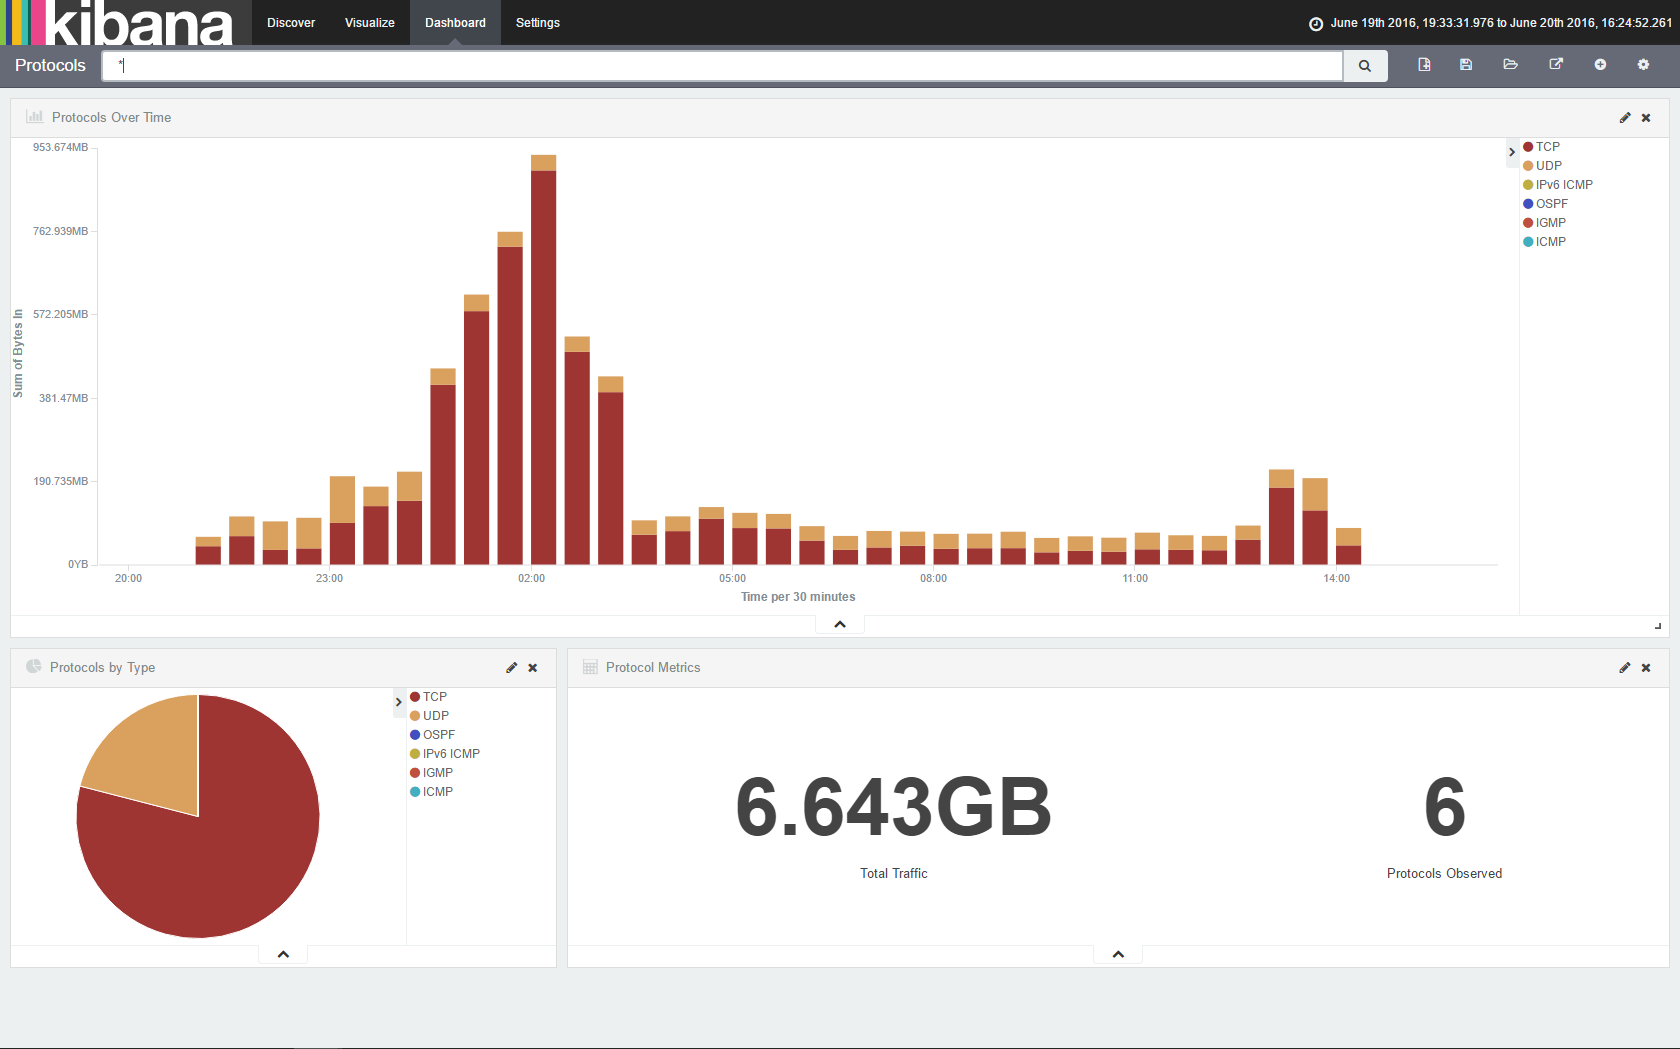
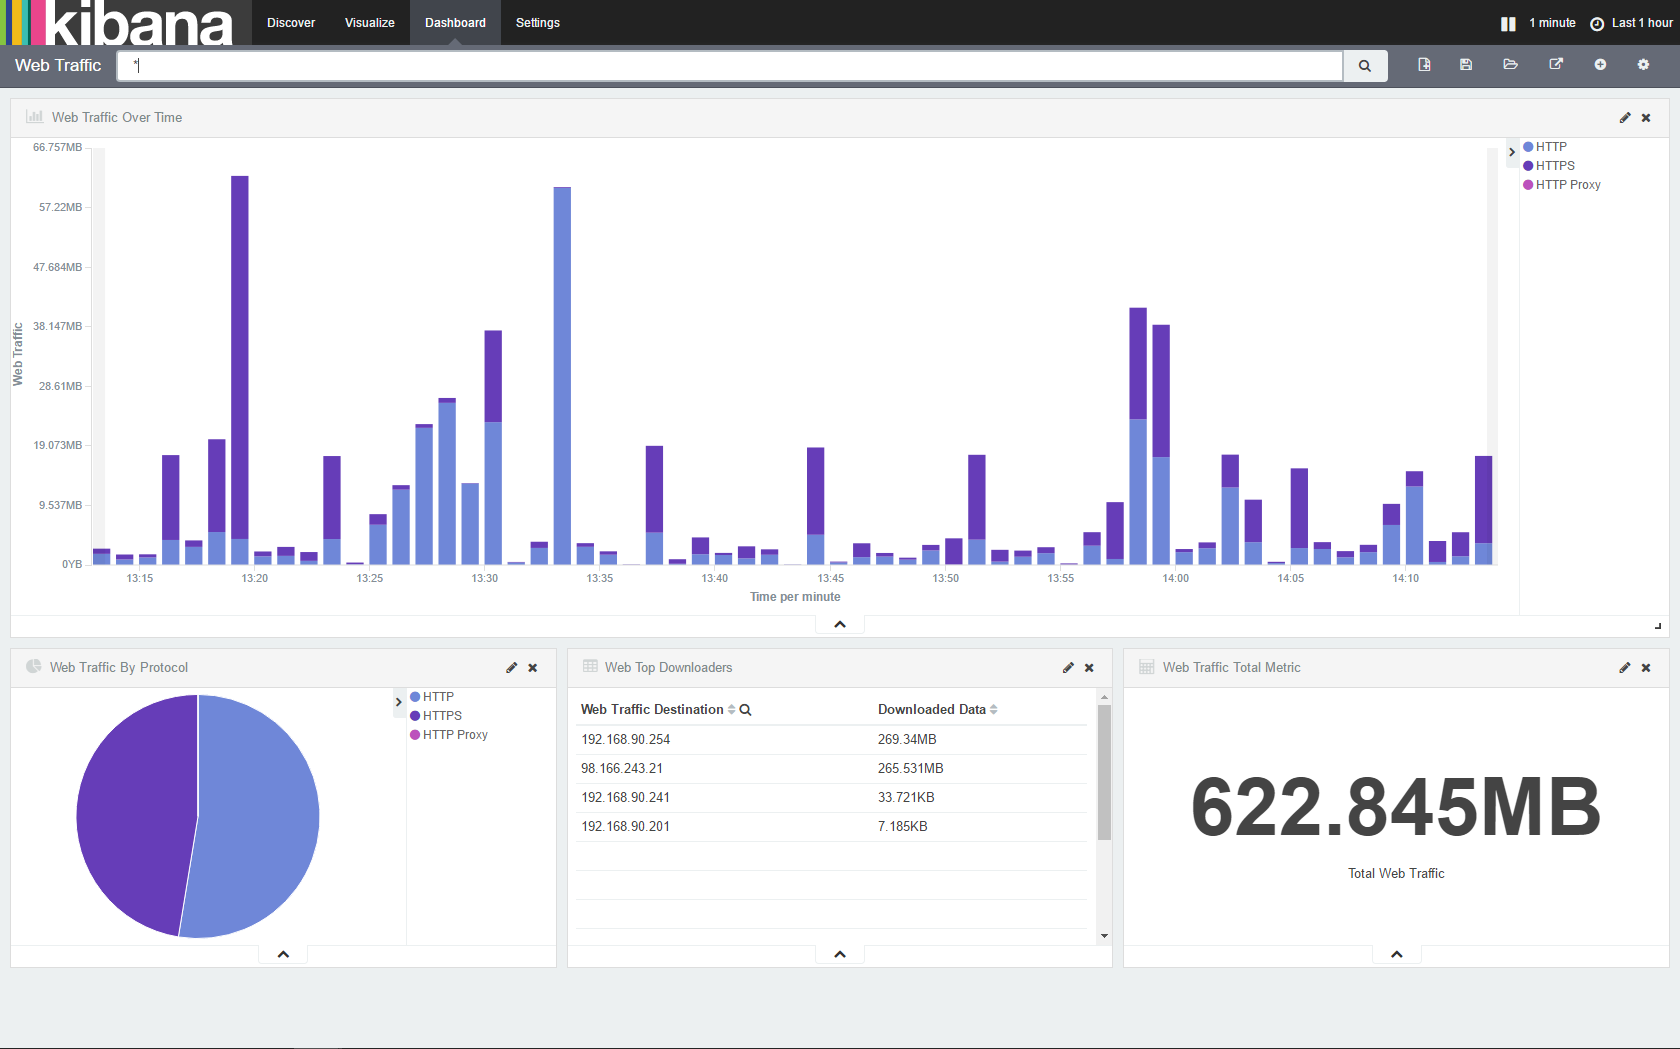
The Manito Networks Flow Analyzer comes pre-loaded with over a dozen dashboards, and almost fifty individual visualizations to help you display and explore network flows. Pre-loaded visualizations can be mixed-and-matched to create new dashboards to suit your workflow, or you can create your own.
By default you get dashboards that show:
- Bandwidth Usage
- Web Traffic (HTTP, HTTPS)
- DNS Traffic
- ICMP Traffic
- Flow Statistics (Flow Count, Sensors, Flow Type)
- Protocol Overview (TCP, UDP, ICMP, etc)
- Traffic Overview (HTTP, DNS, FTP, etc)
- RFC 1918 (Private IP address) Downloads / Uploads
- Traffic-at-a-glance
- Unknown Ports In Use
Content-driven dashboards also show the following traffic:
- Streaming Media
- Social Media
- Content Distribution Networks (CDN)
- Cloud Platforms
- Advertising Networks
For organizations that want to create their own dashboards over 50 included visualizations can be used, and search query templates are provided for further customization.


